
The sample count - last election's MVP - explained
Accuracy of result preview relies on sound data gathering

Welcome to Art Science Millennial, a newsletter for non-techies navigating the world of tech! I know the struggle because I’m one of you.
Making your vote count.
In the previous general election, Singaporeans got an early indication of where the results were headed as sample counts - a count of a small portion of votes in each constituency - were released for the first time ahead of the final tally.
These interim numbers were reported a few hours before actual results in 2015, and they proved accurate and performed well within the error of margin that was expected. The Business Times reported that:
This year, the difference between sample results and actual results ranged between zero to about three percentage points. Most constituencies and wards reported results within one percentage point of the sample count result.
This is how the sample count stacked up against the actual result in 2015:

Source: The Business Times
Ahead of Polling Day on July 10, which will again feature the sample count, let’s take a look at how it works.
Wait, why do I have to know this?
Well, there are several reasons:
The fundamental challenge is in picking a sample that is best able to predict the actual makeup of votes. Businesses have the same goal when they collect data. The processes applied to keep the sample count accurate can be followed the next time you’re asked to conduct a survey of a group of customers to predict broader market preferences.
It’s a great chance to understand the science that takes place in our everyday lives, which is the aim of this newsletter.
Knowing more about the electoral process makes us a more informed citizen.
Right, so how is the sample count conducted?
On July 10, Singaporeans will cast their votes at 1,100 polling stations across the country. When the polls close, the ballots are transported to different counting centres, where the sample counts - and subsequently the full counts - are taken.
This graphic from the Elections Department explains the process succinctly:

Source: Elections Department Singapore
As the number of polling stations vary across constituencies, the 2015 sample sizes were about 1,000 for a Single Member Constituency and a few thousand for a Group Representative Constituency, reported The Business Times. A couple of important concepts that should be emphasised:
Random
The hundred ballots chosen from each polling station are picked randomly, meaning that each ballot in the polling station has an equal chance of being selected. This ensures that the 100 ballots are representative of the total votes in the polling station.
What could go wrong if the sample is not randomly picked? Let’s say voters from five HDB blocks vote at one polling station and the sample is picked from only voters who live in a particular HDB block. A candidate might have visited that HDB block many more times than his or her opponent, thus garnering more support there. A sample picked purely from that block would thus reflect a higher vote share for that candidate, which might not be the case across all five HDB blocks that vote at that polling station.
Like what you’re reading so far? Sign up so you don’t miss the next update of Art Science Millennial!
Weightage
The sample counts are weighted according to the number of votes cast at each polling station. This is again a matter of representation, which can be best explained by another example.
Suppose we have a constituency with two polling stations. The first polling station has 1,000 votes while the second has 2,000 votes. To conduct the sample count, We draw 100 random ballots from each polling station.
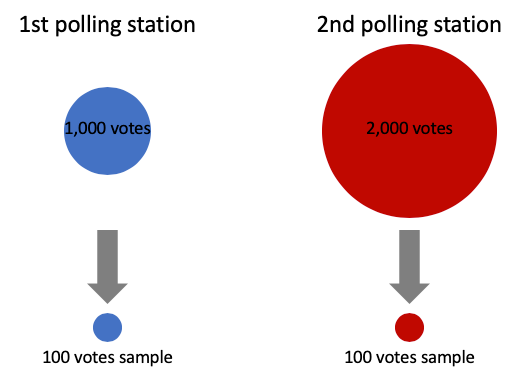
You can sense intuitively that something is wrong if both the blue and red are represented by smaller circles of the same size.
If we simply add up both samples, votes from the first polling station would be over-represented - they make up one-third of the total votes (1,000 out of 3,000) but half of the total sample (100 out of 200). To fix this, a weight of ⅓ is assigned to the sample from the first polling station and a weight of ⅔ is assigned to the sample from the second polling station.
So if a candidate received 54 votes in the sample from the first polling station and 65 votes in the sample from the second polling station, we calculate the overall sample count as such:
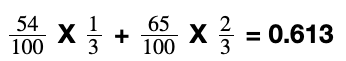
The final sample count of 61.3% for this candidate is closer to the result from the second polling station due to the greater weightage that station has.
OK, so just how accurate is this thing?
The sample count for a constituency is reported to have a confidence level of 95 per cent, plus or minus 4 percentage points.
Erm, in English, please.
Let’s say we had the time to repeat the above process a hundred times, thereby obtaining 100 different sample counts or 100 different estimates of the voting result for one constituency. Out of the 100 different estimates, 95 of them will be within plus or minus 4 percentage points of the actual result. So if the actual result in that constituency is 65 per cent for Party A, 95 of the sample counts will be plus or minus 4 percentage points of 65 per cent. In other words, if we get a sample count of 66 per cent, we are 95 per cent confident that the true vote share lies between 62 per cent and 70 per cent. This range of values (62-70) is also known as the confidence interval.
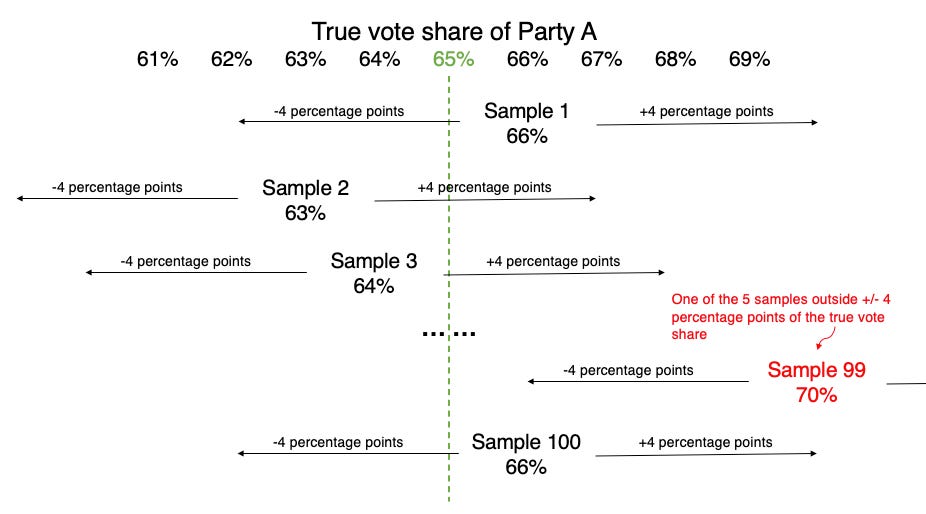
How the 100 different sample counts or estimates would pan out if we had the time to repeat the process 100 times.
Sometimes the confidence level is reported as a 95 per cent probability/chance that the sample count is correct. While this interpretation is intuitive, it is actually technically wrong. The best explanation I could find online comes from this maths forum:
Incorrect Interpretation:
========================
The confusion with interpreting confidence intervals is that people often draw a sample, calculate the mean, construct a single confidence interval and say, "There is a 90% probability that the true mean is within THIS confidence interval." This is wrong because the population parameter, mu, is a constant, not a random variable. Its either in the confidence interval or it's not. There is no probability involved.Correct Interpretation:
======================
Confidence intervals are best interpreted in the context of many samples. Say you construct one confidence interval. Your boss asks you to interpret the answer. You say, "I'm 90% confident that the interval from ___ to ___ actually contains the true population mean." Your boss says, "I'm a little confused, please explain." You say, "If I take 100 random samples each of size n and construct the confidence intervals, then about 90 of them will contain the true population mean."In summary, it really alludes to the process. A confidence level of 90% tells us the process we are using will, in the long run, result in confidence interval limits that contain the population parameter 90% of the time.
Remind me again why this is useful?
Remember that hypothetical survey you might have to conduct to predict broader market preferences? You can now aim to collect representative data by applying the principles of randomisation and weightage.
And you also know there is always a chance that despite your best efforts, you capture a sample that doesn’t reflect the ground truth (Sample 99 in the graphic above).
Great, what else do I need to know?

Nothing else really, except that if you’re Singaporean, perform your civic duty on July 10 and vote!
A couple of useful websites to make your voting smoother:
Check which polling station you should cast your vote at (click on “check your name in the register of electors”).
Check the queue at your polling station (service will start on Polling Day itself).
I’d love to know what you think of this newsletter and what you’d like me to write about. You can reach me at zi.liang.chong@gmail.com or by leaving a comment if you’re reading this on the Art Science Millennial website. If you enjoyed this piece, sign up so you get subsequent updates in your inbox!